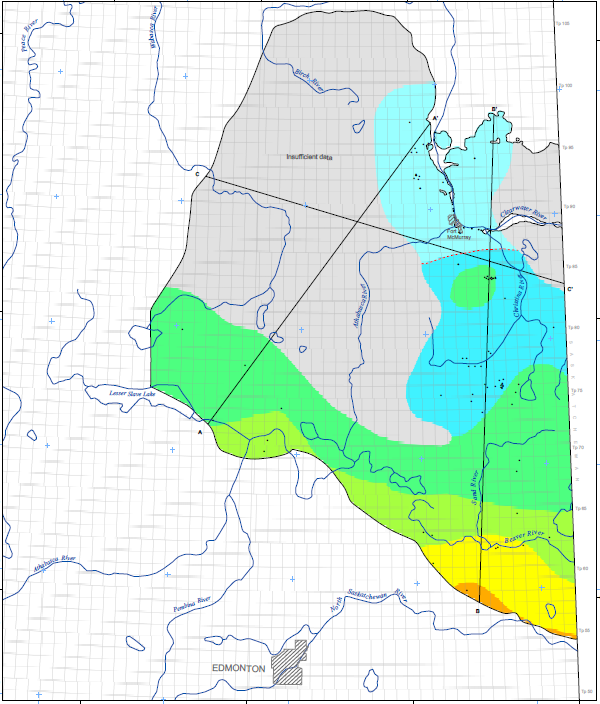
This map depicts the distribution of total dissolved solids (TDS) in groundwater in the Clearwater hydrostratigraphic unit (HSU). The map is a result of an ordinary kriging technique using publicly available water chemistry data from Alberta Environment and Parks' (AEP) Alberta Water Well Information Database (AWWID), compiled information from AGS sources, compiled information from monitoring wells, and formation water chemistry data from oil and gas well drillstem tests and production fluids.
The distribution of TDS was mapped at a regional scale using many years of data, thus providing a good indication of regional water chemistry within the unit rather than site specific values. The uncertainty of prediction is depicted on an inset map, which shows the residual values (predicted value minus measured value) plotted at each location to indicate where underprediction and overprediction occurs. Two additional inset maps show the distribution of hydraulic head and the results of water driving force analysis, respectively. The geometry and variable thickness of the Clearwater HSU are illustrated on schematic cross-sections. The regional lithostratigraphy and hydrostratigraphy of the Clearwater HSU and overlying and underlying units are highlighted in a table.
Lemay, T.G. and Singh, A. (2021): Distribution of total dissolved solids in the Clearwater hydrostratigraphic unit; Alberta Energy Regulator / Alberta Geological Survey, AER/AGS Map 606, scale 1:1 250 000.