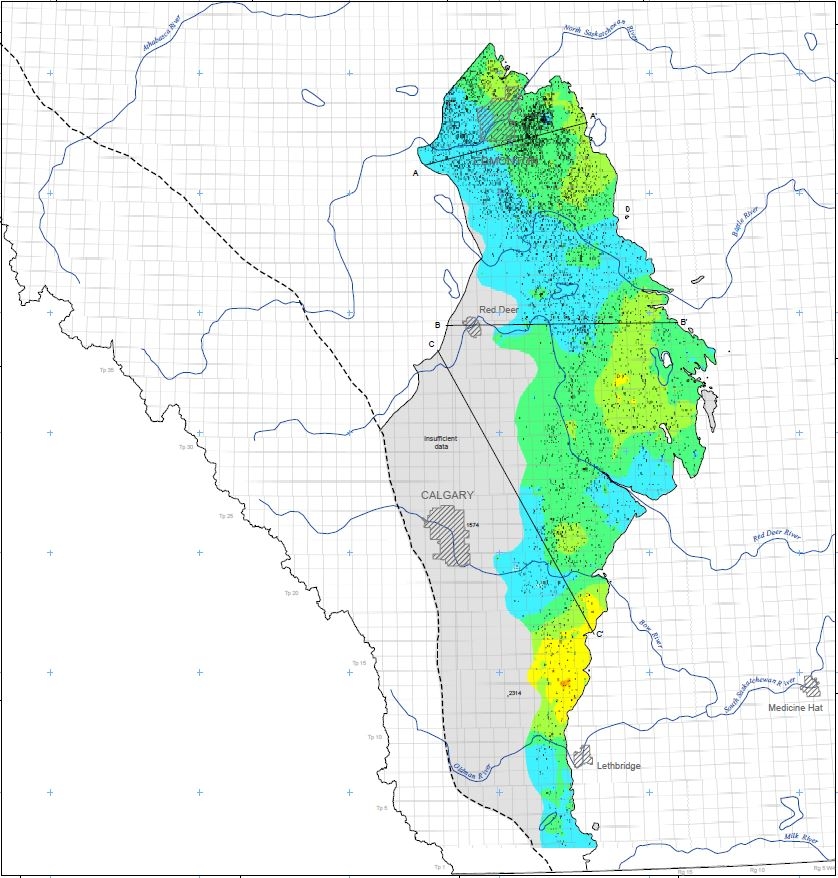
This map depicts the distribution of total dissolved solids (TDS) in groundwater in the Horseshoe Canyon / St. Mary River hydrostratigraphic unit (HSU). The map is a result of an inverse distance weighting technique using publicly available water chemistry data:
- Alberta Environment and Parks' (AEP) Alberta Water Well Information Database (AWWID)
- Alberta Health Services (AHS)
- Alberta Energy Research Institute (AERI)
- Base of water well Testing (BWWT)
- Directive 044 (D044) “Requirements for Surveillance of Water Production in Hydrocarbon Wells Completed Above the Base of Groundwater Protection”
- Formation water chemistry data from oil and gas well drillstem tests (DSTs) and production fluids.
The TDS was mapped at a regional scale using many years of data, thus providing a good indication of regional water chemistry within the HSU rather than site specific values. The uncertainty of prediction is depicted on an inset map, which shows the residual values (modelled value minus measured value) plotted at each location to indicate where underprediction and overprediction occurs. Two additional inset maps show the distribution of hydraulic heads, and depth to and vertical thickness of the Horseshoe Canyon / St. Mary River HSU. The geometry and variable thickness of the Horseshoe Canyon / St. Mary River HSU are illustrated on schematic cross-sections.
Nakevska, N. and Lemay, T.G. (2022): Distribution of total dissolved solids in the Horseshoe Canyon / St. Mary River hydrostratigraphic unit; Alberta Energy Regulator / Alberta Geological Survey, AER/AGS Map 625, scale 1:1 300 000.