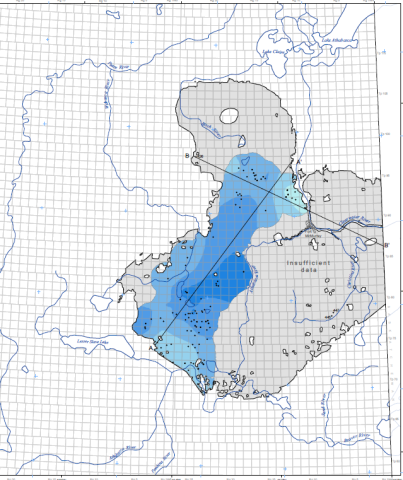
This map depicts the distribution of hydraulic head in groundwater in the Wabiskaw hydrostratigraphic unit (HSU). The map is a result of an empirical Bayesian kriging technique using representative hydraulic head values calculated from drillstem test pressures and static water level data from monitoring wells.
The distribution of hydraulic head was mapped at a regional scale using many years of data, thus providing a good indication of regional hydraulic head within the unit rather than site-specific values. The uncertainty of prediction is depicted on an inset map, which shows the residual values (predicted value minus measured value) plotted at each location to indicate where underprediction and overprediction occurs. Three additional inset maps show the location of tests removed during the Cumulative Interference Index (CII) process, the location of total dissolved solids data in the Wabiskaw HSU, and the source of the data points used to create the Wabiskaw hydraulic head map, respectively. The geometry and variable thickness of the Wabiskaw HSU are illustrated on schematic cross-sections. The regional lithostratigraphy and hydrostratigraphy of the Wabiskaw HSU and overlying and underlying units are highlighted in a table.
Rubin, A.D., Brinsky, J. and Welsh, B. (2025): Distribution of hydraulic head in the Wabiskaw hydrostratigraphic unit; Alberta Energy Regulator / Alberta Geological Survey, AER/AGS Map 650.