Understanding subsurface temperature is a foundational step for assessing a geothermal resource. Alberta’s long history of petroleum exploration and production resulted in abundant measurements of subsurface temperature. Using this data, we are completing a study that will result in several products, including a subsurface temperature database, a subsurface temperature model, and subsurface temperature maps for individual rock formations
About Geothermal Temperature Mapping
The main sources of subsurface temperature data in Alberta are test results from oil and gas activities. These tests include drillstem tests (DSTs; which test production capabilities of a well), annual surveys of pressure and temperature in oil and gas pools, and temperatures recorded at the bottom of an oil or gas well (bottom-hole temperatures; BHTs) during geophysical (i.e., wireline) logging. The DSTs and annual pool surveys are considered reliable sources of data, whereas BHTs are usually lower than the actual rock temperature due to the cooling effect of mud circulating in the wellbore during drilling. We created a temperature correction equation using temperatures from DSTs and annual pool surveys to calibrate the uncorrected BHTs. Applying this new correction equation to existing BHTs provided us with a representative rock formation temperature. We added these data points to existing temperature datasets, consisting mainly of DST and annual pool survey data, where they underwent a statistical process to identify and remove anomalous values, resulting in a subsurface temperature database for depths >1000 m.
Using data from our subsurface temperature database, we created a three-dimensional (3D) subsurface temperature model of the province. The model was created using a geostatistical interpolation method (i.e., kriging). Interpolation methods use known values to predict values in unknown areas. We publish predictions from this model as tabular point cloud data, which provide temperature predictions for x,y,z locations. For this dataset, we exported temperature predictions from the model as point cloud data with x,y geographic coordinates every 4000 m, and z depth coordinates starting at 1000 m below the Earth’s surface and increasing at 125 m intervals down to the top of the Precambian basement.
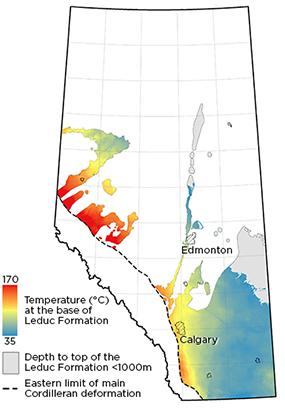
Using predictions from our subsurface temperature model, we created formation-scale temperature grids in GIS file formats that illustrate temperature distribution across a geological unit (e.g., formation or member). Our initial focus was on creating grids for some of Alberta’s deeper sedimentary formations, which may warrant future geothermal exploration and development. We also created grids displaying the temperature distribution at the base of the sedimentary succession (located at the top of the Precambrian basement) and the thermal gradient calculated at the top of the Precambrian basement.